Build a chart, spreadsheet, or presentation you can verify
These outputs need a review of the underlying data as well as the appearance. Start with explicit source values and a clear audience.
Charts and spreadsheets
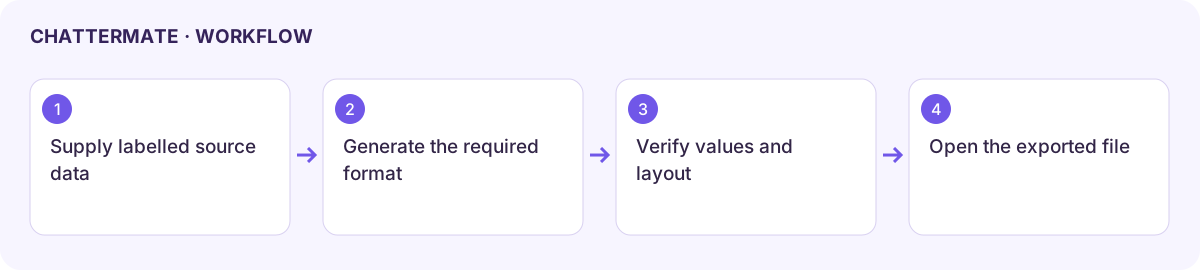
Section titled “Charts and spreadsheets”- Attach the permitted data file or paste a small labelled table with units and dates.
- Ask for the required output and calculation. For example: “Make a bar chart of these monthly volunteer hours; preserve all values and show hours on the vertical axis.”
- Open the generated artifact in Canvas. Check labels, ordering, missing values, totals, and any formula results against the source.
- For a spreadsheet, inspect editable cells and formulas through the actual viewer. A table in a chat reply is not automatically a downloadable spreadsheet.
- Use the available export and open the file in its intended application. Verify formulas and data types after export.
Presentations
Section titled “Presentations”Specify the audience, purpose, slide count, and required sections. Review the outline before asking for full slides when that workflow is offered. Inspect every slide for text fit, factual accuracy, image relevance, and reading order. Request focused revisions to the relevant slide.
Use the actual Slides or presentation export when available, then open the saved file. Check editability, fonts, notes, charts, and image placement in the destination viewer. A PDF or screenshot export does not preserve an editable slide deck.
Fix a result
Section titled “Fix a result”For wrong calculations, identify the exact source row and expected formula. For a misleading chart, name the units, scale, or category order to correct. For overflowing slides, shorten the text or split the content rather than only shrinking the font.
Next: Canvas, Library, and data and presentations overview.
Workflow at a glance
Section titled “Workflow at a glance”